Why the Stock Market is Holding its Breath: A Guide to the Fed, Inflation, and What’s Next
If checking your investment portfolio has recently prompted a desire to hide, you’re in good company. Both the S&P 500 and the tech-heavy Nasdaq have been experiencing significant stock market volatility, creating a sense of unease on Wall Street. This widespread anxiety stems from the anticipation of two major catalysts: upcoming U.S. economic data and the Federal Reserve’s next move on interest rates. This isn’t just financial drama; it’s a high-stakes economic turning point. Let’s break down the factors at play.

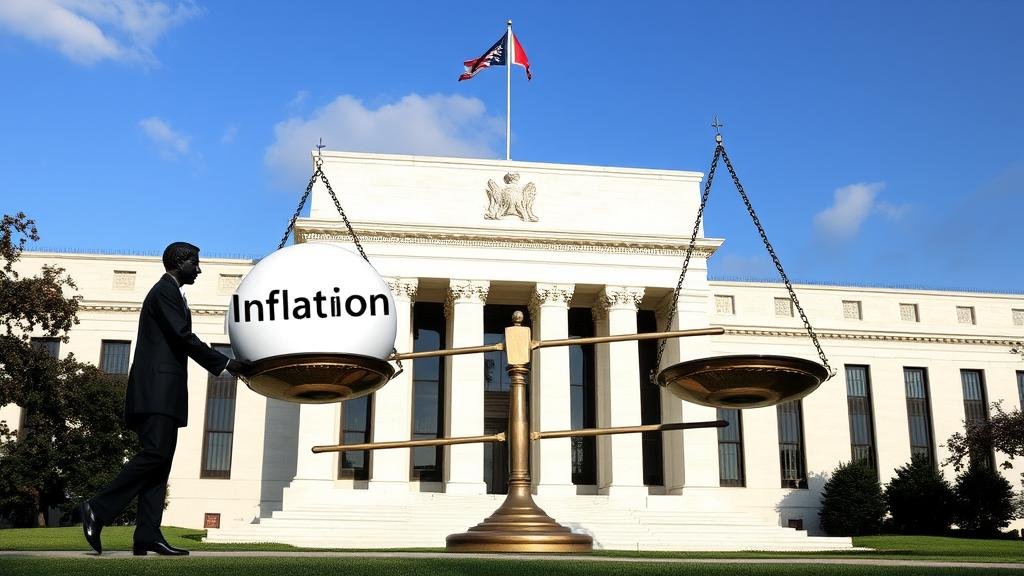
The Waiting Game: All Eyes on the Federal Reserve
Think of the Federal Reserve as the guardian of the U.S. economy, tasked with maintaining a delicate balance. Their goal is to prevent runaway inflation without triggering a full-blown recession. The primary tool at their disposal is the federal funds rate, which influences borrowing costs across the economy.
When the Fed raises this rate, it becomes more expensive for businesses and consumers to borrow money, which is intended to cool down economic activity. For the stock market, the prospect of a rate hike often triggers a sell-off. Higher rates can negatively impact corporate earnings, making investors nervous.
Consequently, “Fed-watching” has intensified. Analysts scrutinize every statement from the Fed chair, searching for clues about future policy. A “hawkish” stance, suggesting a greater willingness to raise rates, tends to send stocks lower. Conversely, a “dovish” tone, hinting at steady or lower rates, can spark a market rally.
Economic Data: The Information Fueling the Fed’s Decisions
The Federal Reserve has repeatedly emphasized that its decisions are “data-dependent,” meaning they rely on the latest economic indicators to guide their actions. Here are the key reports that have everyone’s attention:
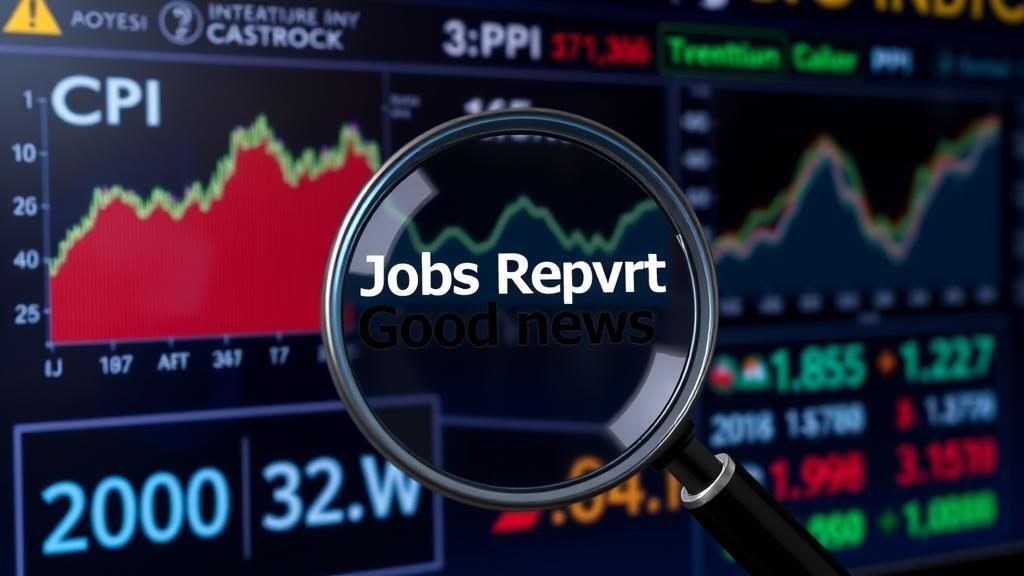
- Consumer Price Index (CPI): This is the primary measure of inflation, tracking the average change in prices paid by urban consumers for a basket of consumer goods and services. A high CPI reading is a major red flag for the Fed.
- Producer Price Index (PPI): This report tracks inflation from the perspective of producers—the prices they receive for their output. Rising producer prices often foreshadow higher consumer prices.
- The Jobs Report: This monthly report provides a snapshot of the labor market, including employment levels and wage growth. Paradoxically, a strong jobs report can be viewed as a negative by the market. A tight labor market with rising wages can contribute to inflation, increasing pressure on the Fed to raise interest rates. This “good news is bad news” scenario can be confusing for new investors.
The Ripple Effect: How Different Market Sectors Are Reacting
This period of uncertainty is impacting various sectors of the market differently.
The Nasdaq’s Tech Woes
The Nasdaq, which is heavily weighted toward technology companies, is particularly sensitive to interest rate fluctuations. Many tech companies are valued based on their projected future earnings. When interest rates rise, the present value of those future earnings decreases, which can lead to lower stock prices. Even market leaders like Nvidia (NVDA) have not been immune to this pressure.
The S&P 500’s Broader Struggle
The decline in the S&P 500, which represents 500 of the largest U.S. companies, indicates that the concern has spread beyond the tech sector. A falling S&P 500 suggests that the economic headwinds are affecting a wide range of industries.

What This Means for Your Portfolio
Seeing losses in your investment account can be unnerving. However, it’s important to remain calm and avoid making rash decisions.
- Don’t Panic: Emotional investing is a common pitfall. Selling into a downturn can lock in losses.
- Diversification is Key: A diversified portfolio, spread across various asset classes and sectors, can help mitigate the impact of a downturn in any single area.
- Stay Informed: Understanding the reasons behind stock market volatility can help you maintain a long-term perspective and make more informed decisions.
- Is This an Opportunity? For long-term investors, market downturns can present buying opportunities. Dollar-cost averaging, which involves investing a fixed amount of money at regular intervals, allows you to buy more shares when prices are low, potentially leading to greater wealth accumulation over time.
In conclusion, the stock market is currently in a state of suspense, awaiting clear signals from the Federal Reserve and key economic data. Until there is more certainty, investors should expect continued stock market volatility. The most prudent course of action is to remain disciplined, stay informed, and focus on your long-term financial goals.