Is a 3rd Stock Market Crash Imminent Under Trump?
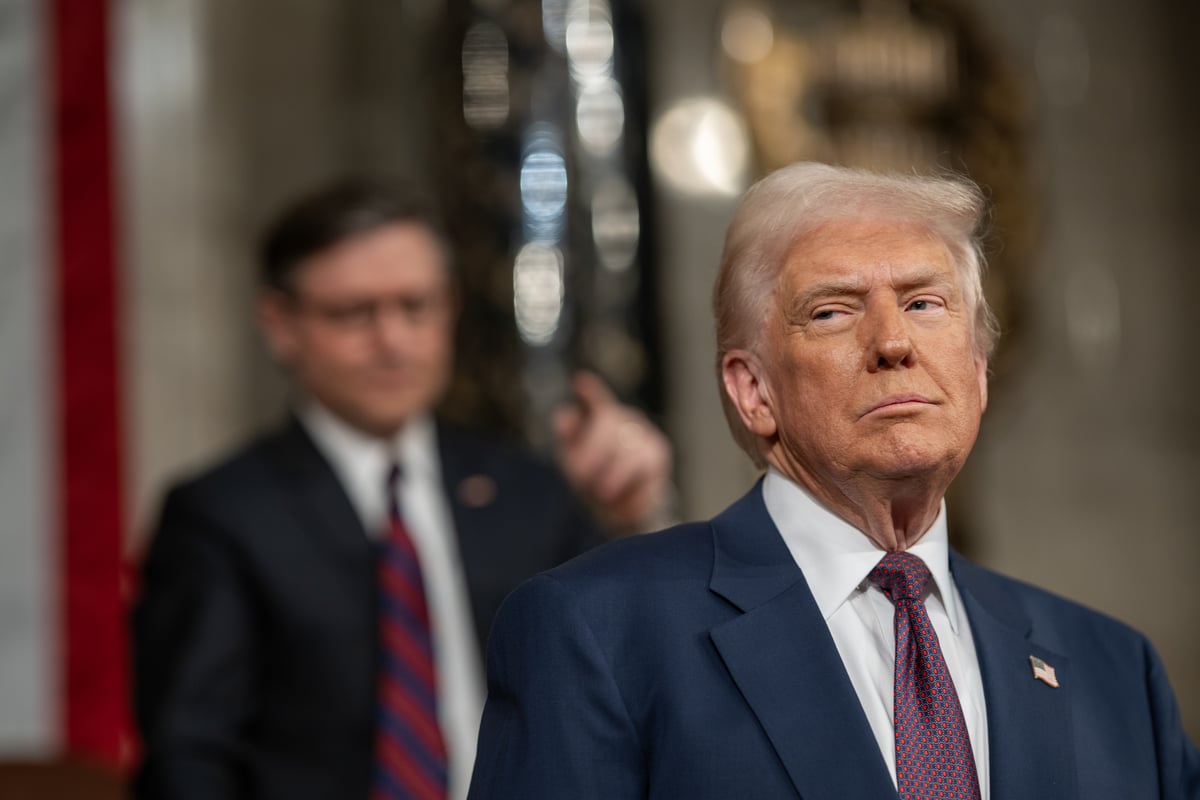
Is a 3rd Historic Stock Market Crash Imminent Under President Donald Trump? Here's What the Data Says.Image Credit: Yahoo Finance
Key Points
- •NEW YORK – Wall Street has navigated a period of both remarkable growth and extreme volatility under President Donald Trump, whose second, non-consecutive term has seen equity markets surge to new heights. Yet, this rally is shadowed by the memory of two historic market shocks during his tenure, prompting investors to scrutinize historical data for signs of a third major downturn.
- •First Term Gains (Jan. 2017 - Jan. 2021): The Dow Jones Industrial Average (^DJI) climbed 57%, the benchmark S&P 500 (^GSPC) rose 70%, and the tech-heavy Nasdaq Composite (^IXIC) soared an incredible 142%.
- •Second Term Gains (Jan. 20, 2025 - Jan. 28, 2026): In just over a year, the Dow has added 13%, the S&P 500 is up 16%, and the Nasdaq has rallied 22%.
- •The COVID-19 Crash (2020): In the early stages of the global pandemic, fear and uncertainty triggered a swift and brutal market collapse. In a span of just 33 calendar days between February and March 2020, the S&P 500 lost 34% of its value.
- •The Tariff Shock (2025): More recently, the unveiling of President Trump's new, aggressive tariff and trade policy in April 2025 sent a shockwave through the market. In the two trading sessions from the close of April 2 to the end of April 4, the S&P 500 plunged 10.5%, marking the fifth-steepest two-day decline for the index since 1950.
Is a 3rd Historic Stock Market Crash Imminent Under President Donald Trump? Here's What the Data Says.
NEW YORK – Wall Street has navigated a period of both remarkable growth and extreme volatility under President Donald Trump, whose second, non-consecutive term has seen equity markets surge to new heights. Yet, this rally is shadowed by the memory of two historic market shocks during his tenure, prompting investors to scrutinize historical data for signs of a third major downturn.
The S&P 500 has already endured a dramatic, tariff-induced plunge in this second term, following the unprecedented COVID-19 crash of 2020. With market valuations now stretched to their second-highest levels in over 150 years, a close examination of key indicators is essential to determine if another precipitous fall is on the horizon.
The Trump Rally: A Tale of Two Terms
President Trump's time in the White House has been characterized by powerful equity market performance, a trend that has defined both his first and second terms.
His first term, from January 2017 to January 2021, produced some of the highest annualized returns for a president in modern history. By the time he left office, the market had posted staggering gains.
The rally has resumed in his second term. Since Inauguration Day on January 20, 2025, the major indices have continued their upward trajectory, rewarding investors who remained in the market.
- First Term Gains (Jan. 2017 - Jan. 2021): The Dow Jones Industrial Average (^DJI) climbed 57%, the benchmark S&P 500 (^GSPC) rose 70%, and the tech-heavy Nasdaq Composite (^IXIC) soared an incredible 142%.
- Second Term Gains (Jan. 20, 2025 - Jan. 28, 2026): In just over a year, the Dow has added 13%, the S&P 500 is up 16%, and the Nasdaq has rallied 22%.
A History of Abrupt Volatility
These impressive gains have been punctuated by two of the sharpest market declines in recent history, establishing a pattern of volatility that keeps investors on edge.
- The COVID-19 Crash (2020): In the early stages of the global pandemic, fear and uncertainty triggered a swift and brutal market collapse. In a span of just 33 calendar days between February and March 2020, the S&P 500 lost 34% of its value.
- The Tariff Shock (2025): More recently, the unveiling of President Trump's new, aggressive tariff and trade policy in April 2025 sent a shockwave through the market. In the two trading sessions from the close of April 2 to the end of April 4, the S&P 500 plunged 10.5%, marking the fifth-steepest two-day decline for the index since 1950.
Warning Sign #1: Sky-High Valuations
One of the most compelling arguments for caution comes from a time-tested valuation metric: the Shiller price-to-earnings (P/E) ratio, also known as the cyclically adjusted P/E (CAPE) ratio.
The Shiller P/E Ratio
This metric smooths out short-term profit volatility by using average inflation-adjusted earnings from the previous 10 years. It provides a clearer picture of long-term market valuation.
- Current Reading: As of January 28, 2026, the S&P 500's CAPE ratio stands above 41.
- Historical Context: This figure is more than double the historical average of 17.33, which dates back to 1871. It represents the second-most expensive U.S. stock market in history, trailing only the 44.19 peak reached just before the dot-com bubble burst in 2000.
- Predictive Power: History shows a strong correlation between elevated CAPE ratios and subsequent market downturns. The ratio has only surpassed a reading of 30 on six occasions in 155 years. The previous five instances were each followed by severe bear markets, with major indices falling anywhere from 20% to as much as 89%.
Warning Sign #2: The Economic Drag of Tariffs
The second major red flag concerns the tangible economic impact of the administration's protectionist trade policies, a factor that directly contributed to the market's recent two-day seizure.
The New York Fed Findings
A December 2024 report from four New York Federal Reserve economists, published for Liberty Street Economics, provides a data-driven look at the consequences of the tariffs implemented during Trump's first term.
- The Study's Focus: The economists analyzed the performance of U.S. firms most affected by the 2018-2019 tariffs on Chinese imports.
- Key Results: The research found that these companies experienced statistically significant declines in labor productivity, employment levels, sales, and overall profits between 2019 and 2021.
- The Lag Effect: Crucially, the negative impacts were not a short-term shock but a prolonged drag that lasted for years. This suggests that the economic fallout from the new 2025 tariffs could weigh on corporate earnings and economic growth for the foreseeable future, creating a headwind for stock prices.
The Verdict: Imminent Crash or Growing Headwinds?
While the Shiller P/E ratio and the proven economic harm of tariffs paint a worrisome picture, neither indicator suggests that a 1929- or 2020-style market crash is imminent.
An imminent crash implies a sudden, sharp, and immediate event. The data, however, points to a different kind of risk: a period of sustained pressure, higher volatility, and a greater probability of a significant correction or a more prolonged bear market.
High valuations can persist for months or even years before they revert to the mean. Similarly, the economic drag from tariffs is a slow-burn issue that erodes fundamentals over time rather than causing an instantaneous collapse. The conditions are ripe for a downturn, but timing its arrival is impossible.
The Bottom Line for Investors
For long-term investors, the current environment demands perspective and discipline rather than panic. History's most important lesson is that market downturns, while painful, are temporary and ultimately create opportunities.
- History as a Guide: Every correction, bear market, and crash in Wall Street's history has eventually been erased by a subsequent bull market rally. The only guarantee over the long run is that the market trends up.
- The Power of Time: The COVID-19 crash provides a perfect case study. The 34% loss was fully recovered in under six months. Since hitting its pre-crash peak in August 2020, the S&P 500 has more than doubled in value, demonstrating the immense cost of panic-selling.
- Optimism as a Strategy: Unpredictability is the only certainty in the short term. Market downturns are a normal and healthy part of the investing cycle. For investors with a long-term horizon, these periods of pessimism have consistently proven to be generational buying opportunities, rewarding those who stay the course.
Source: Yahoo Finance
Related Articles
Nationwide Protests Against ICE Enforcement Erupt in U.S.
Thousands are protesting ICE after the DOJ declined to investigate a fatal agent-involved shooting in Minneapolis, fueling a national movement and public anger.
Venezuela Amnesty Bill Could Free Political Prisoners
Learn about Venezuela's proposed amnesty bill to release political prisoners. The move could signal a major political shift and affect future economic sanctions
Pokémon Cancels Yasukuni Shrine Event After Backlash
The Pokémon Company has canceled an event at Tokyo's controversial Yasukuni Shrine after facing international backlash from China and South Korea.
US to Lose Measles Elimination Status: What It Means
The U.S. is poised to lose its measles elimination status due to escalating outbreaks. Learn what this downgrade means for public health and the economy.